A functional and interactive expense management application. This project focused on state management, data flow between components, and providing a clean user experience for tracking financial data.
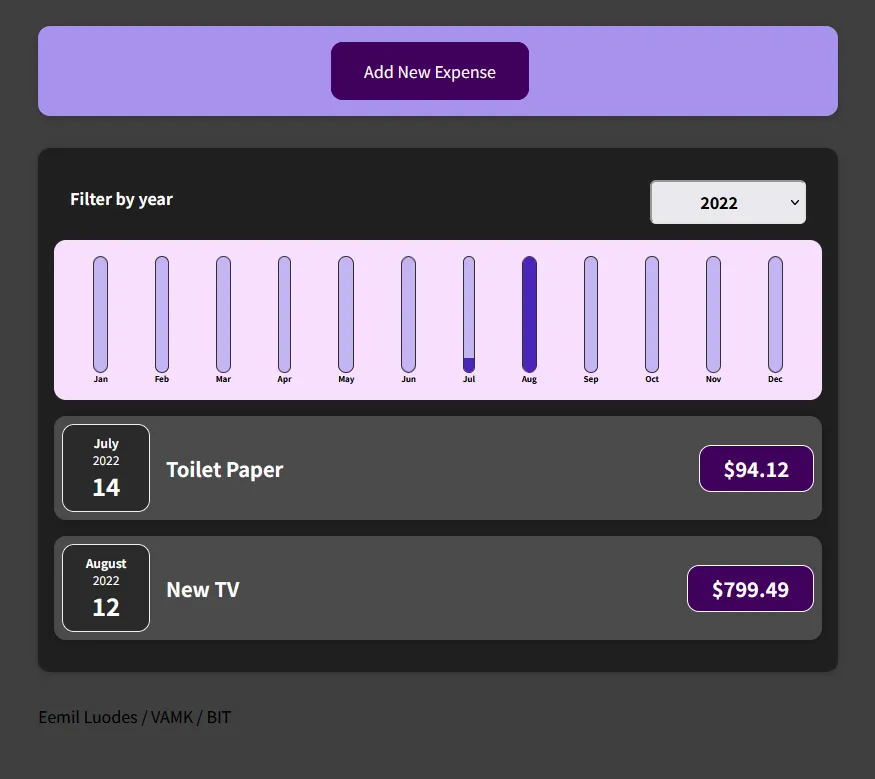 The main user interface featuring the expense list and monthly chart visualization.
Key Features
- Dynamic Data Filtering: Allows users to filter and view expenses by year.
- Data Visualization: Built-in charting logic to display monthly expense distribution.
- State Management: Handles real-time updates as users add new entries.
Tech Stack & Logic
- React: Used for building the component-based architecture.
- JavaScript (ES6+): Logic for filtering, mapping, and aggregating data.
- Component Hierarchy: Focused on efficient data flow.
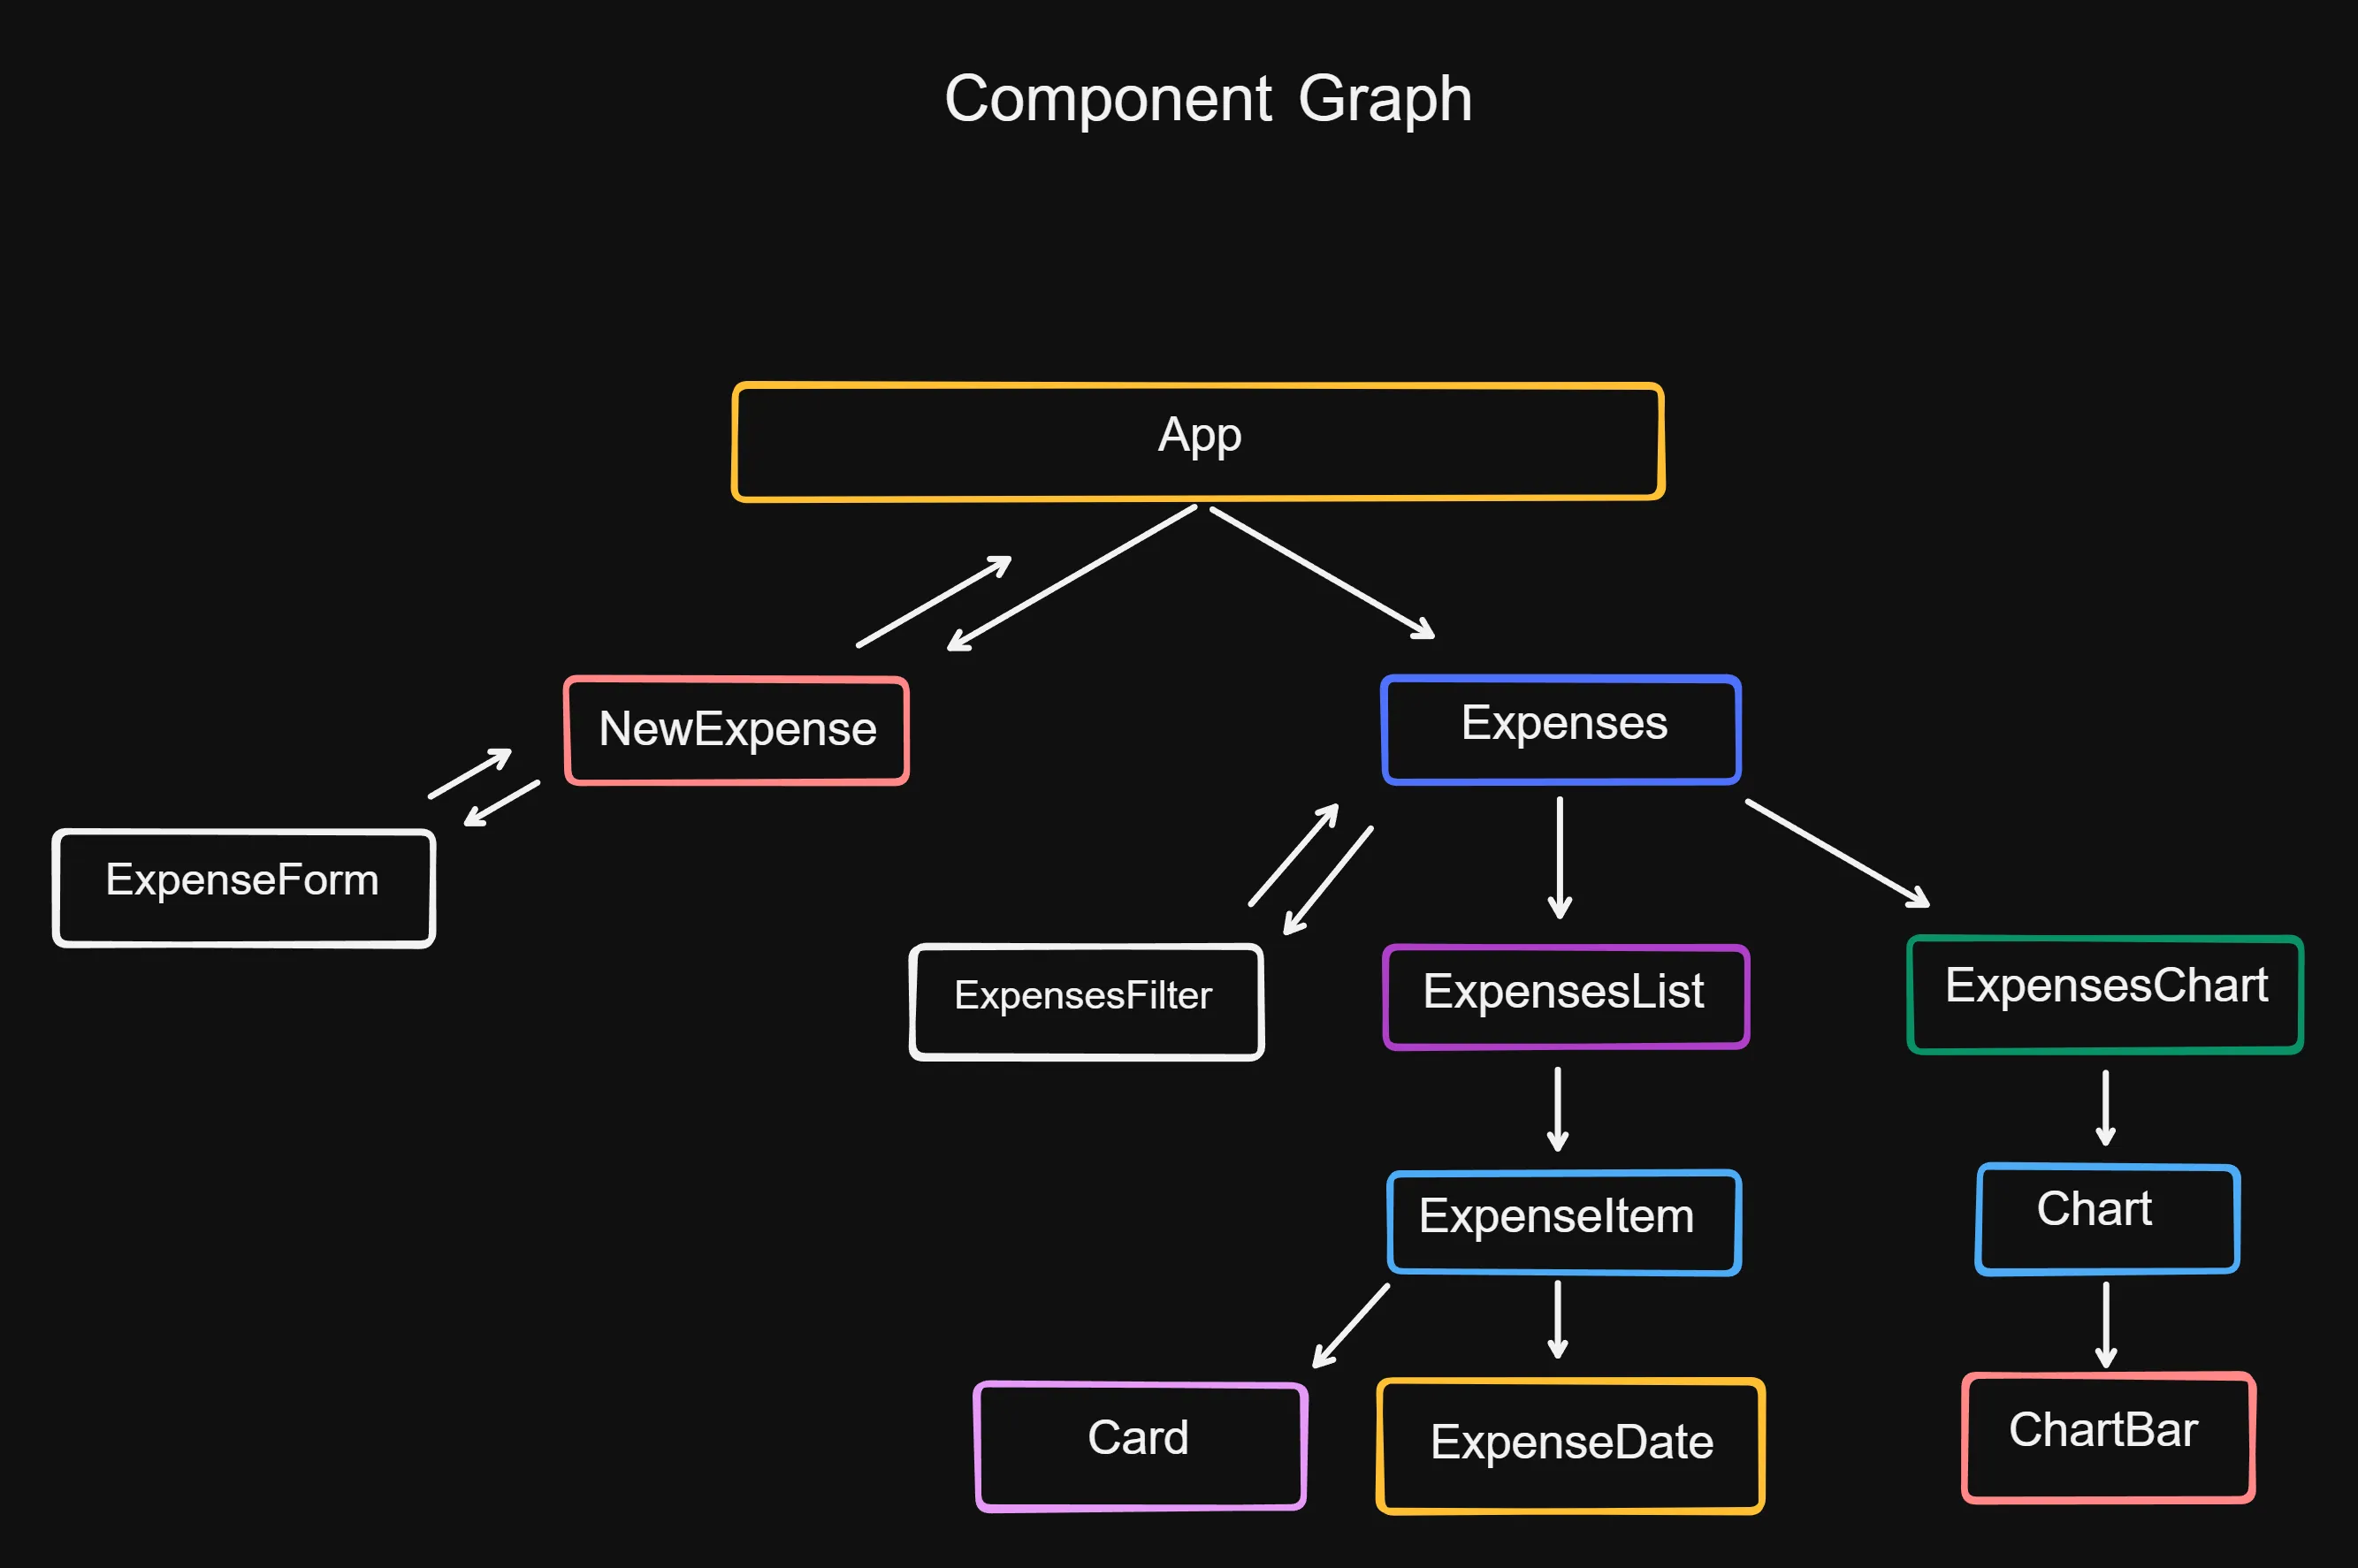 Detailed breakdown of the component hierarchy and data flow.
Data Flow & Project Structure
The project highlights a clear understanding of how data moves within a system:
- Entry: New expense data is captured via forms.
- Processing: Data is passed to the main application state.
- Filtering: Logic is applied to sort data based on user-selected criteria.
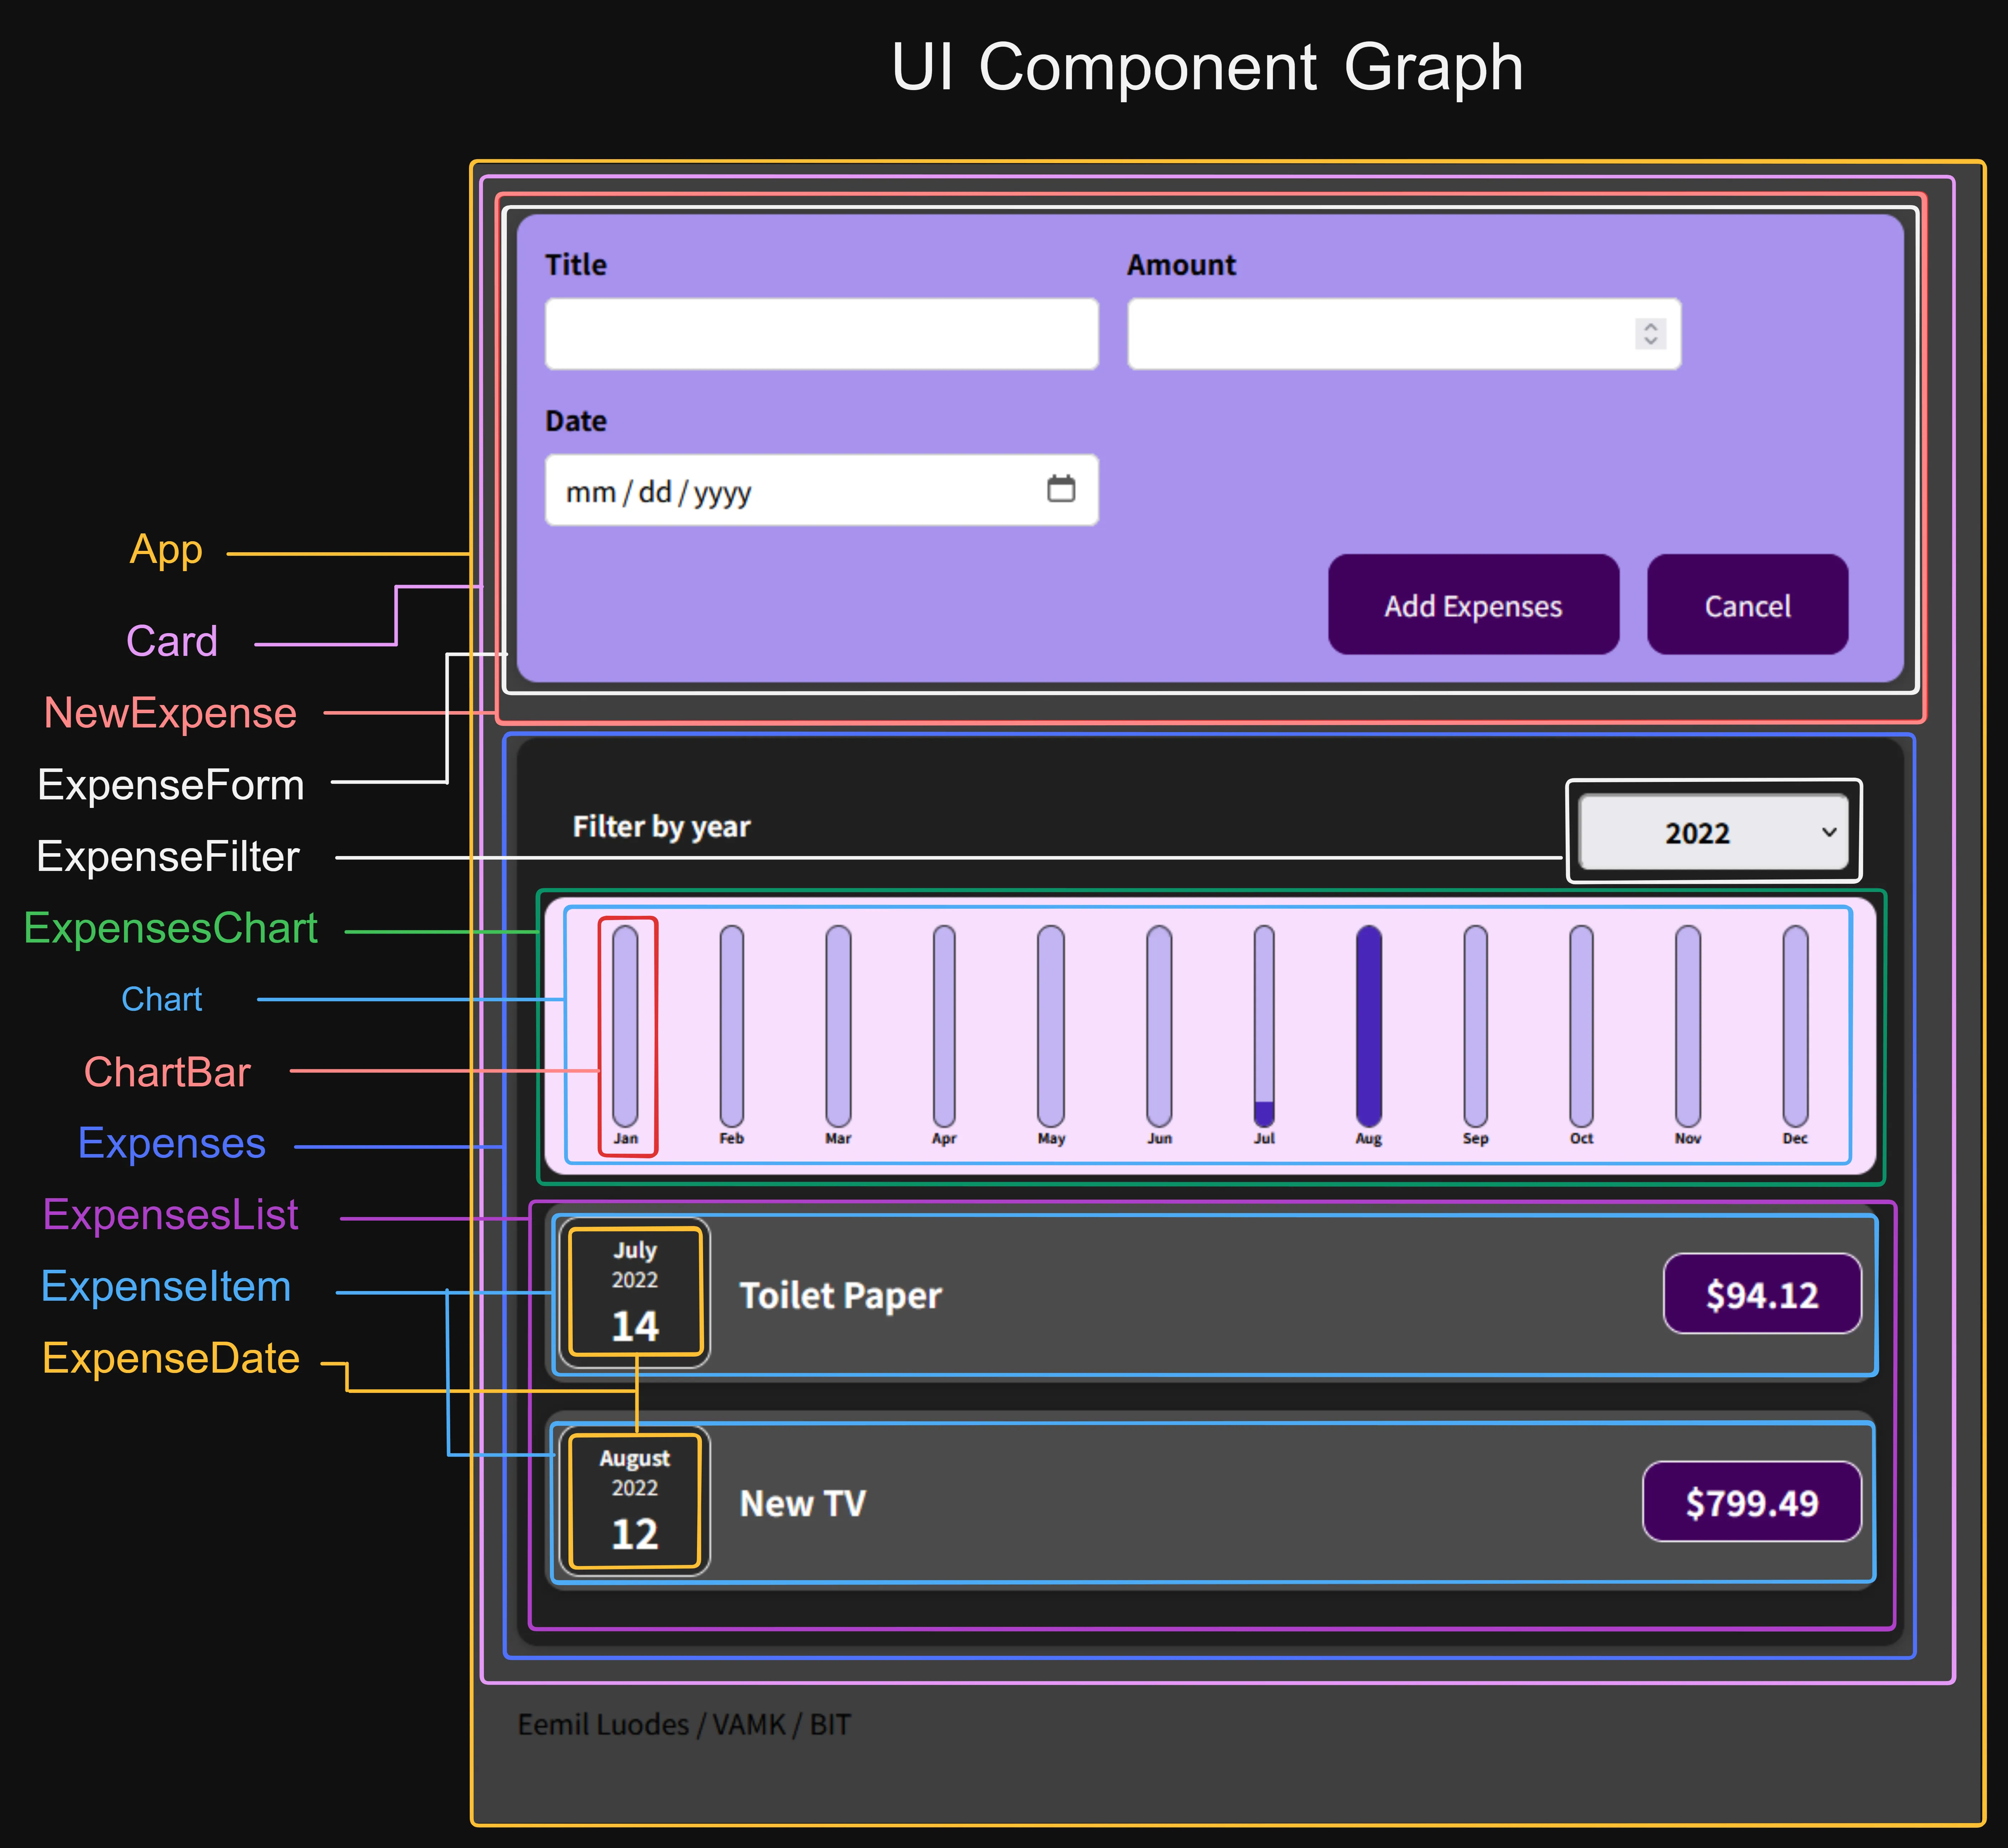 Folder structure and organization of the React application.
Learning Points
While this project is built with React, the primary takeaway was mastering logic-based problem solving: how to take raw user input and transform it into meaningful, filtered visualizations. It demonstrates a solid grasp of modern front-end fundamentals and the ability to manage application state effectively.